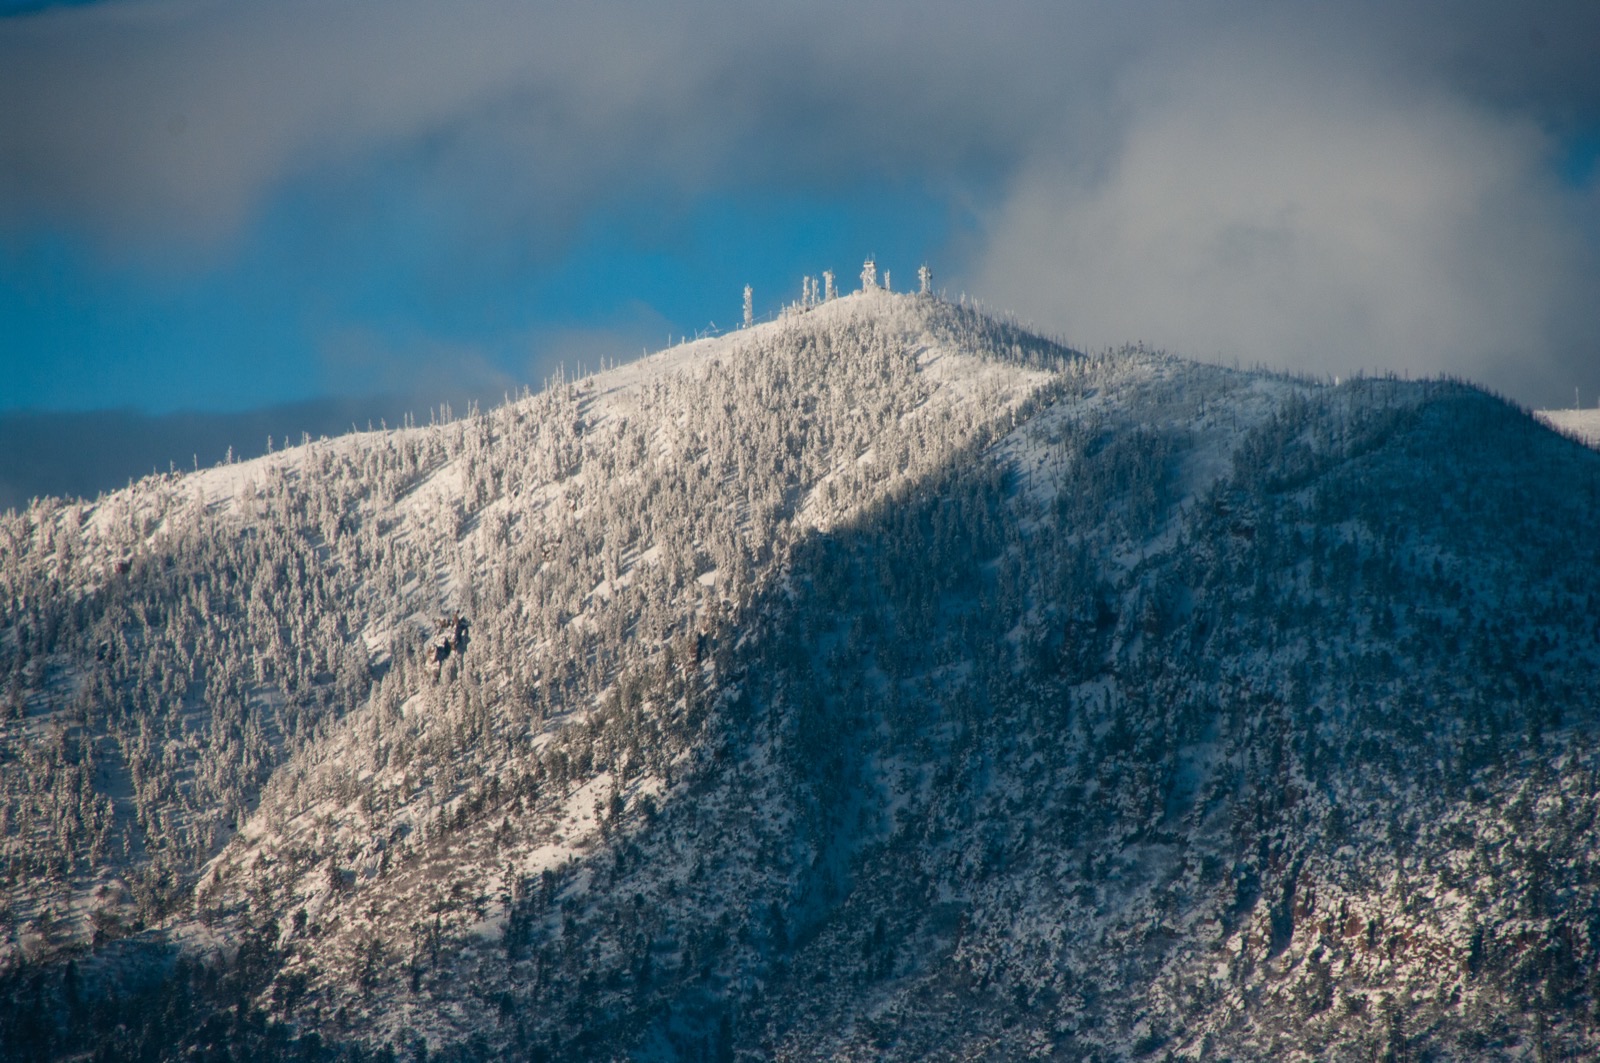
North Slope Borough, Alaska · 70.25°N · 148.34°W · Market: Telecom
Telecom towers and wind-induced vibrations
What is wind-induced vibration, and where does the damage land?
Steady wind sheds vortices off alternate sides of a slender tower, pushing it sideways. The tower sways across the wind, rocks along it, and can twist. When the shedding rate meets a natural frequency, the motion locks in and grows. Bending stress is highest at the base, so that is where the fatigue damage concentrates.
At what wind speed does my structure lock in?
Drag the wind speed to see predicted amplitude. The response is a band, because real motion scatters around the trend. This is the prediction; the sensors below record what happens.
- Predicted amplitude
- 9.1-17.7 mm
- Shedding frequency
- 1.52 Hz
- 1st / 2nd mode
- 1.5 / 4.5 Hz
- Lock-in winds
- 17, 50 mph
How much fatigue life has each location already spent?
Measured cycles are sorted by amplitude and summed against an S-N curve to give each location's spent fatigue life. The ranking drives the real decision: which sections need a damper, and how many to buy.
Cycles are binned by amplitude, converted to a stress range, and summed against an S-N curve by Miner's rule. The red high-amplitude buckets, though rare, carry most of the damage. Illustrative synthetic data, not a measurement of any real structure.
Damage is summed against the EN 1993-1-9 Category 90 welded-detail curve.4
Where do you put the sensors?
Three sensors, each answering a different question. Near the top for the cleanest motion signal, mid-mast to catch the higher mode, and at the base where stress and fatigue are highest. Placement follows the tower's mode shapes.
Which sensors handle vibration monitoring?
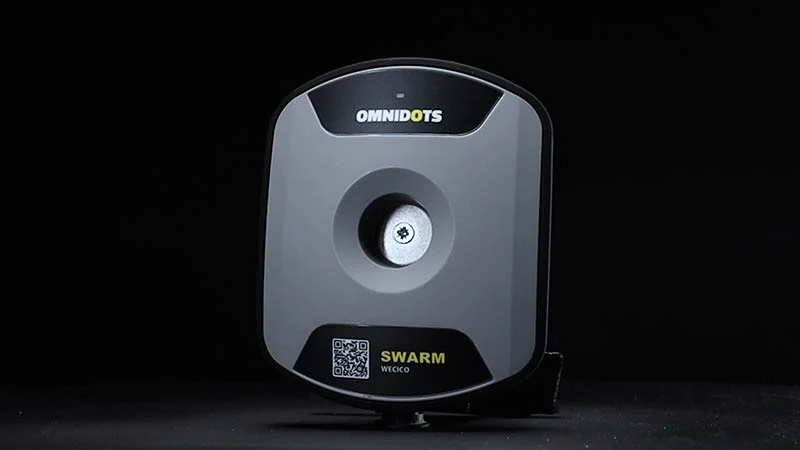
Wind-induced vibration is a fast, three-axis signal at a remote, frozen, off-grid site. The sensor has to capture all of it and phone home on its own power.
- Triaxial
- Separates cross-wind sway, along-wind rocking, and torsion.
- 1 kHz capture
- Fast enough to resolve the waveform, so vortex shedding is told apart from turbulence.
- Cold and ice rated
- Runs through the Arctic winter and survives icing on the housing.
- Wireless backhaul
- Cellular telemetry for sites with no fixed network.
- Solar plus battery
- Self-powered for sites with no grid, through the polar night.
What wind drives the vibration, and from which direction?
The damaging events arrive from a narrow bearing: the prevailing E wind, which hits the tower most broadside. The rose shows how often it blows; the scatter shows how hard it shakes.
Wind blows from the E most of the year at Deadhorse, mean 11.9 mph, the direction most nearly perpendicular to the tower face. That is why the base weld is the focus area.
Petal length is the share of hours from each direction; segments split it by speed band. Shape anchored to Deadhorse PASC climatology; per-direction values illustrative.
What happens if we install a tuned mass damper?
A wind forecast run through the model shows expected amplitude with and without a damper. Because fatigue scales with stress cubed, a modest cut in amplitude sharply slows the fatigue clock.
The damper raises modal damping from 0.8% to 2.2% of critical, flattening the resonant peak and trimming the broadband response every day. Because fatigue scales with stress cubed, the accrual rate drops far more than the amplitude. Illustrative forecast.
Is the vibration vortex shedding, or turbulence?
The distinction sets the fix. Vortex shedding is a narrow oscillation across the wind at the natural frequency, so the cross-wind axis dominates one sharp spectral peak. Turbulence spreads energy across every axis and frequency.
summarize_dataset on the cross-wind trace above, plotted straight from its histogram JSON. The U-shape — samples piling up at the two extremes — is the signature of a dominant sinusoid sweeping through its peaks: lock-in. Pure turbulence would mound up in the middle instead. Synthetic sample (see Sources).
Are the sensors healthy?
Remote Arctic monitoring is only as good as its uptime. Battery state, last-seen time, and link status sit on one panel, so a unit going dark in a freeze-up is caught before it leaves a gap in the fatigue record, not discovered at the next site visit.
What are conditions at the site right now?
Monitoring an Arctic site means staring down the same weather the structure does: wind, light, and storms, in real time.
Live: Dalton Highway, Atigun Pass, Brooks Range (Alaska DOT&PF 511).
Live wind over Prudhoe Bay (Windy).
Why is measuring vibration harder in the Arctic?
Deadhorse averages 11.9 mph from the E and has gusted to 109 mph. Cyclic loading is near-constant, so you have to capture events continuously, not sample them.5
North Slope sites have no line power and little bandwidth. SSD instrumented more than 30,000 aboveground spans in exactly these conditions; historically the data came off by hand on infrequent visits.6
Freeze-up cuts solar input and saps batteries, and ice loads both sensors and structure. Ice is implicated in most of the 140 US tower failures CRREL has recorded since 1959.3
TIA-222-H carried no method to assess vortex-induced vibration. Only the 2024 TIA-222-I adds vibration and fatigue, so legacy towers were never analyzed for it.7
So how do you know the tower is still safe?
About 140 US communication towers have collapsed under ice and wind since 1959, roughly four a year, and the count is acknowledged to be incomplete.3 Each one is filed under the weather on the day it falls, not the years of cyclic loading that spent its fatigue life first. A calendar inspection cannot tell you the natural frequency has drifted or a connection has loosened. Continuous monitoring can, and it can warn you before the next big event.
Live alerts
Lock-in forecast, ~14 h: 18-22 mph from the E drives the base weld to a predicted 16 mm (+0.4% fatigue). The alarm fires before the wind arrives; an inspection would miss it.
Act nowCan I point my own AI agent at this over MCP?
Yes. The same general BeadedCloud MCP tools run on vibration and fatigue data — no key needed. Below is live output from the fatigue tool on this page's amplitude histograms; an agent calls the identical tool on your measured traces.
Tap a question below to see what a connected agent returns ↓
Take the engineering spec sheet with you
One page: what the monitoring system measures, the sensor and deployment specs, and the standards it aligns to. PDF.
Want this view on your structure?
Circumpolar.ai turns vibration and wind sensors into live amplitude, frequency-drift, and fatigue-cycle dashboards with alarms, built for sites with no grid power and thin connectivity. Early access is open.
Sign up for circumpolar.ai