Northwest Arctic Borough, Alaska · 66.85°N · 162.60°W
Kotzebue: wind turbines on warming permafrost
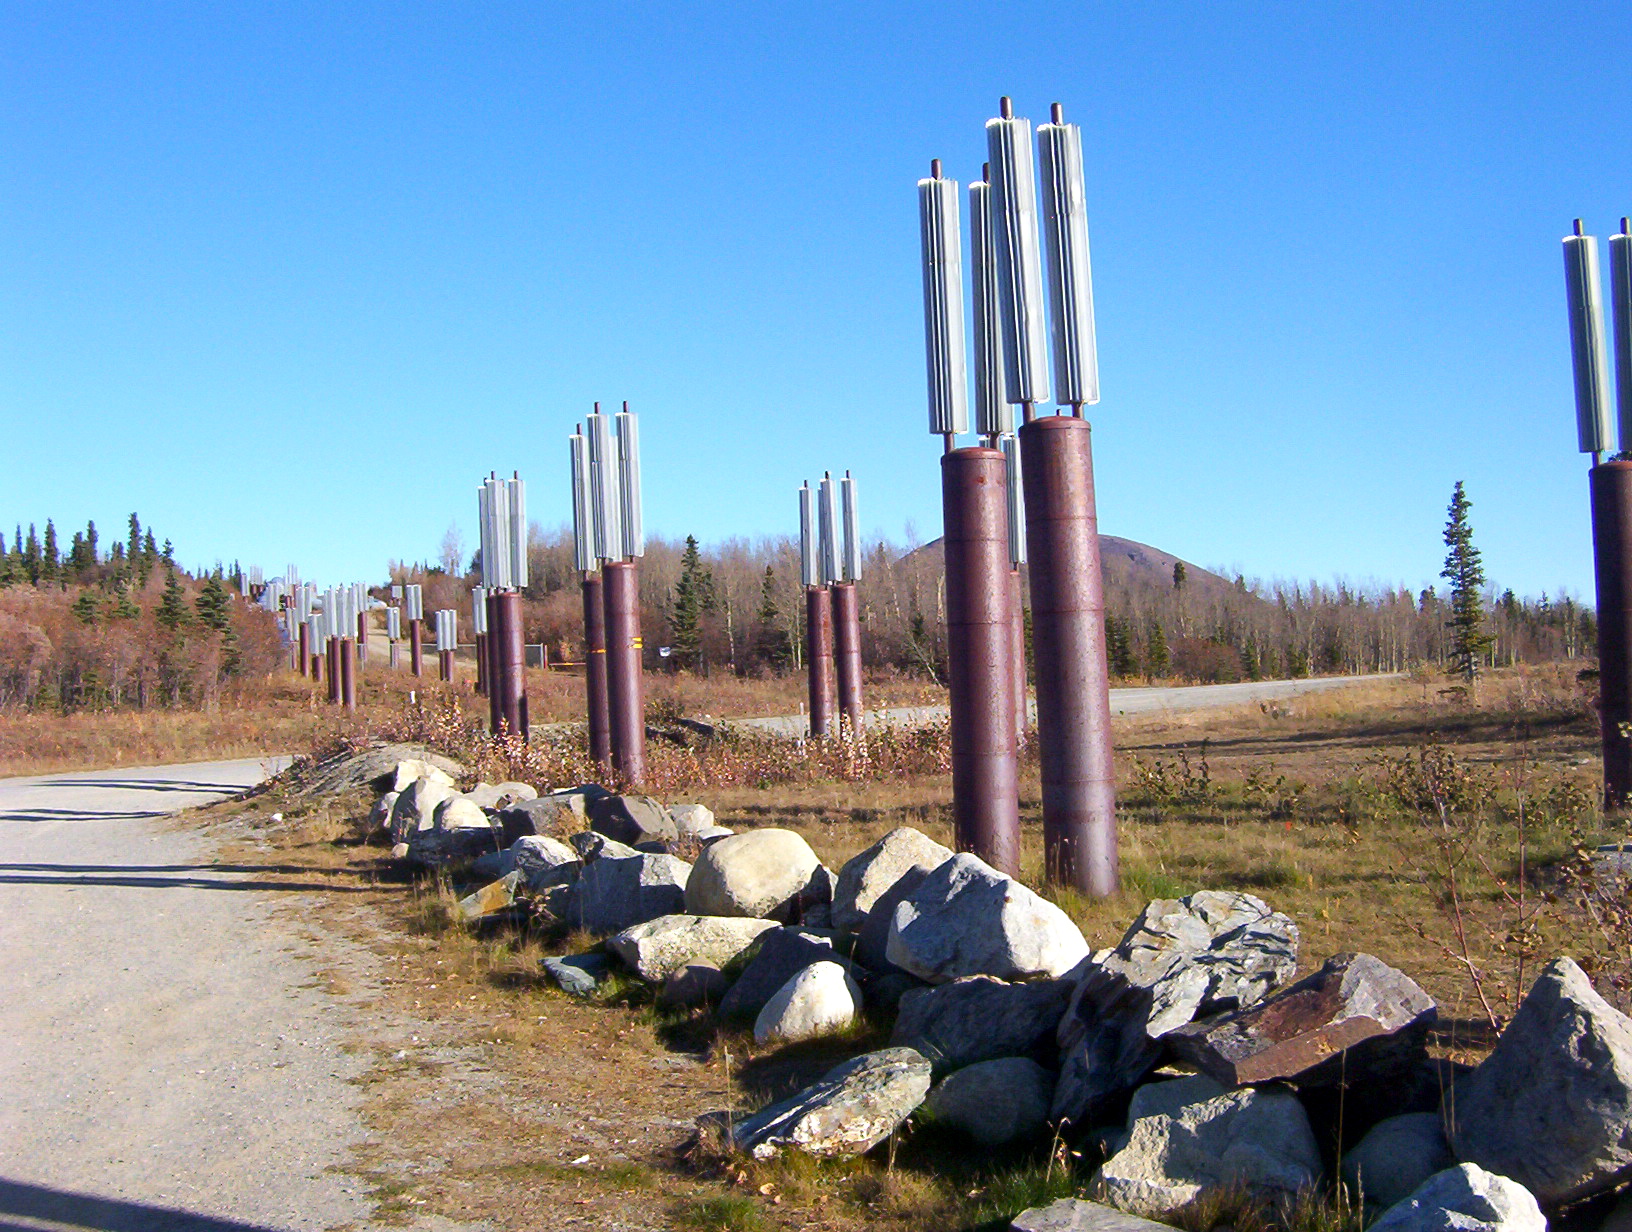
Will my wind turbine fall over due to permafrost thaw?
* Not today. The thermosyphon design should keep the ground frozen based on current temperatures.
How do the thermosyphons work?
KEA pairs each freeze-back piling with a passive thermosyphon, a sealed two-phase heat pipe with a refrigerant inside.
In winter, when the air is colder than the surrounding soil, refrigerant at the buried evaporator absorbs ground heat and rises as vapor. It condenses against the radiator fins exposed to cold air, falls back as liquid, and the cycle drives heat out of the ground.
In summer, when the air is warmer than the ground, the cycle stops on its own. The ground is aggressively cooled every winter and rides on that stored cold through the next thaw season.
The same approach appears in AVEC's Kasigluk and Toksook Bay turbines.
Foundation sensors can monitor thermosyphon effectiveness over time.
Where should I site the next turbine?
- ContinuousNSPF > 90%
- DiscontinuousNSPF 50 to 90%
- SporadicNSPF 10 to 50%
- IsolatedNSPF < 10%
Source: circumpolar.ai permafrost API.
“You cannot dig a hole in the tundra. You are just going to develop a lake.”
Matt Bergan, former KEA Project Engineer
Background: Seward Peninsula tundra, USGS / Dan Ruthrauff, public domain
How is the air temperature changing?
Kotzebue's mean annual air temperature warmed about 2.7 °C between the 1951 to 1980 baseline (-6.2 °C) and the 2014 to 2023 decade (-3.4 °C).
SNAP / UAF earthmaps.io CMIP5 5-model-average downscaled product (decadal era means).
How big can storm surges get?
Kotzebue Sound only got its own continuous tide gauge in 2003, but the record since then plus the 1974 Bering Sea storm at Nome shows the upper edge keeps moving. The October 2024 event was the first to breach the Kotzebue seawall.
Peak water levels above MHHW, NOAA Tides & Currents stations 9491094 Red Dog Dock and 9468756 Nome. Disaster declarations from FEMA. 1974 surge per NWS Anchorage.
Is the coast still there?
The Kotzebue waterfront is stable today because of the seawall. The Chukchi-facing coast around the wind-farm corridor is not. BELA barrier islands averaged 1.5 m/yr of erosion 2003 to 2014, and Shishmaref 60 miles west is moving the entire village.
Mean shoreline-change rates from Farquharson et al. 2018 (Marine Geology) and Alaska DGGS RI 2021-3.
What is the wind doing right now?
Live wind forecast from the European Centre for Medium-Range Weather Forecasts (ECMWF).
What else should I be watching?
Can I ask an AI agent about this record over MCP?
Point your own Claude (or any MCP agent) at BeadedCloud and it can interrogate this temperature record with the same general, industry-agnostic tools that work on any time-series. Below is live output from those tools on the real station record — no setup, no key.
Tap a question below to see what a connected agent returns ↓
Want this view on your site?
Circumpolar.ai builds site-specific insight pages, permafrost-API access, and sensor-driven monitoring for Arctic operators. Early access is open.
Sign up for circumpolar.ai